Data Visualization Techniques for Clearer Public Policy Communication
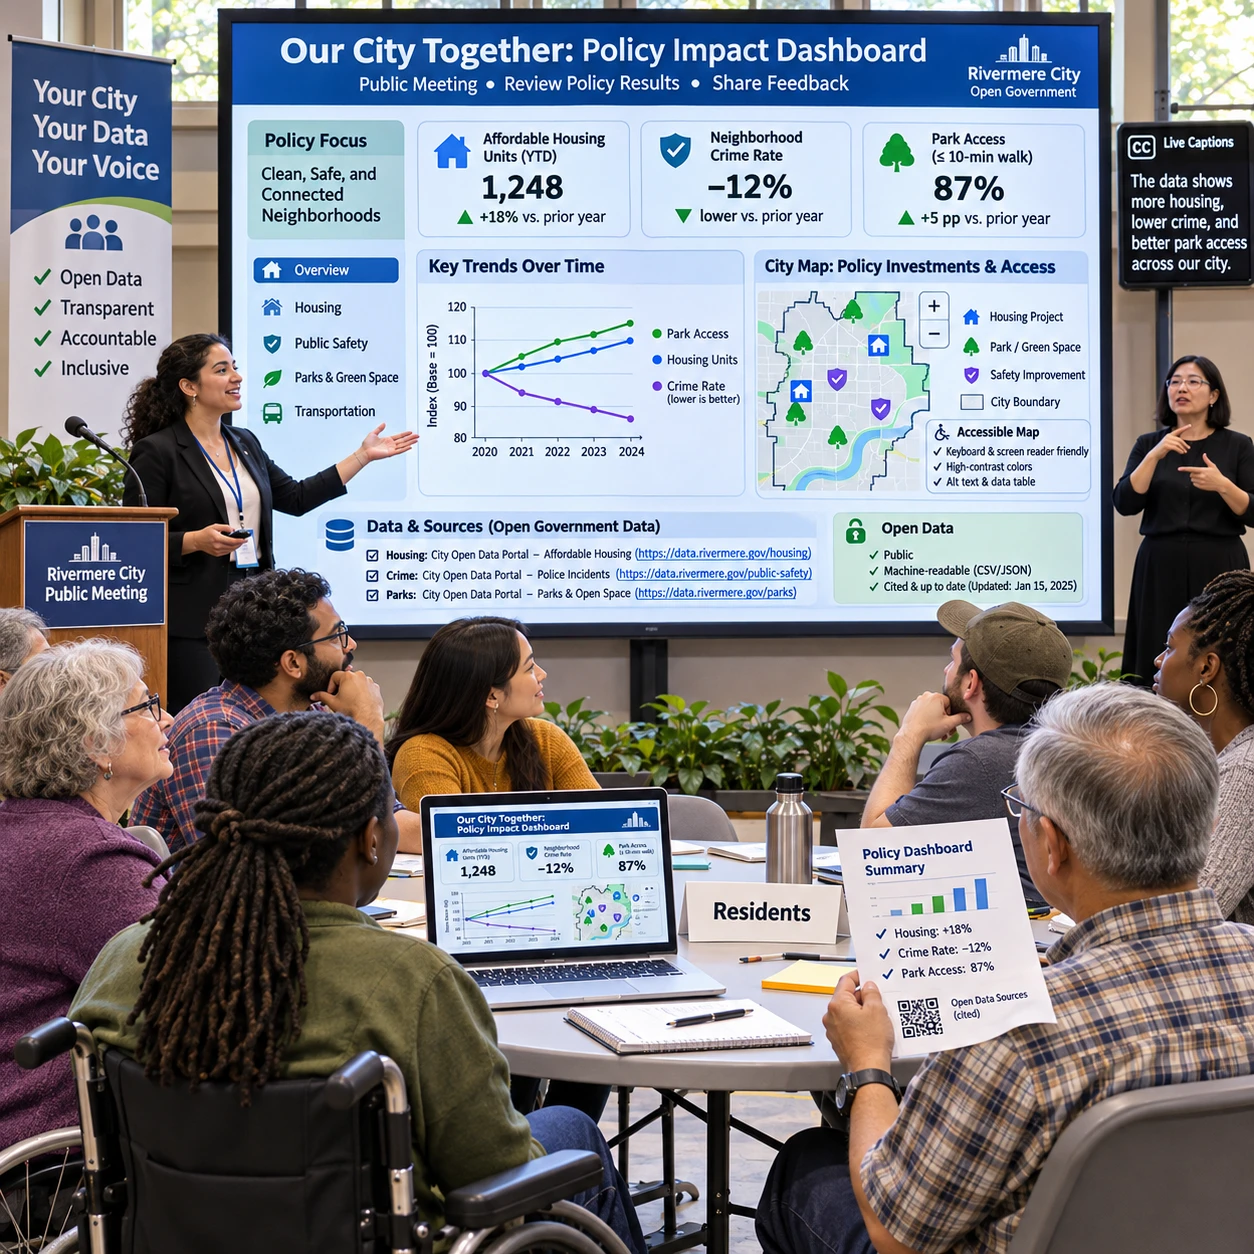
Public policy data can help people understand government decisions, track public services, and question whether programs are meeting their goals. But a chart is useful only when readers can see what it measures, where the evidence came from, and what it can—and cannot—show.
Strong data visualization starts with a public question, then pairs the evidence with an appropriate visual form. Clear labels, accessible design, transparent methods, and honest context let people scrutinize the evidence rather than simply admire the graphic.
Start with the policy question and audience
Begin by stating the decision or public question the visualization should help people understand. Then identify the audience and the information they need to interpret the evidence.
A city budget team might ask, “How did spending on road repairs change over five years?” Residents may want to know which neighborhoods received repairs and how that compares with reported road conditions. Those questions call for different views of the same public policy data.
Before choosing a chart, write a one-sentence takeaway that the data can support. For example: “Reported pothole repairs increased across the city from 2021 to 2025.” Check that the data actually measures completed repairs, covers the stated period, and supports the comparison. If it records requests rather than completed work, the takeaway must say so.
Next, consider the audience’s likely needs. Elected officials may need a concise trend for a briefing; residents may need neighborhood-level detail and a way to inspect the underlying records. A public-facing visualization can serve both by leading with a readable summary and offering the data, definitions, and filters for closer examination.
Decide what action or understanding the graphic should support, but avoid designing it to push a predetermined political conclusion. Public engagement depends on helping people examine evidence, including evidence that complicates the initial message.
Match the visualization to the data
Choose charts and graphs based on the relationship in the data: comparisons, changes over time, distributions, or geographic patterns. The simplest form that answers the question is often the clearest.
- Compare categories: Use a bar chart to compare spending across departments or service requests across districts. Start the value axis at zero when bar length represents magnitude, and label categories directly when practical.
- Show change over time: Use a line chart for a continuous sequence, such as monthly transit ridership or annual emissions. Include the time span and note breaks or changes in how data was collected.
- Show a distribution: Use a histogram, box plot, or dot plot to reveal the range and spread of values, such as how long residents wait for permit decisions. A single average can hide long waits or uneven service.
- Show geographic patterns: Use a map when location is central to the question, such as the distribution of public facilities. Add a legend, identify the geographic unit, and explain whether values are totals, rates, or estimates.
Maps need particular care. A district with more residents may have more service requests simply because more people live there. A rate per resident or household may make comparisons fairer, but rates can be unstable in areas with small populations. State the denominator and avoid implying that a shaded boundary explains why a pattern exists.
For exact comparisons, a table may work better than a map or complex chart. Consider offering both: a visual summary for quick reading and a downloadable table for people who need precise values. More interactive controls can help users explore, but they also add design and maintenance demands; they should not be required to access the main finding.
Make charts clear and accessible
Make charts accessible by using plain-language labels, readable contrast, and a text alternative that conveys the important information. People should not need to rely on color, vision, or a mouse alone to understand the result.
Use a descriptive title that states what is measured, where, and when. Label axes with units, such as “Dollars per resident” or “Requests per 1,000 households,” and define abbreviations. Put key values near the relevant marks when that reduces the effort needed to compare them.
Color should distinguish categories, not carry meaning by itself. Pair colors with direct labels, patterns, or symbols, and check that text and graphic elements have adequate contrast. Avoid using red and green as the only way to distinguish outcomes; some readers have color-vision deficiencies, and colors can also carry unintended political associations.
For data accessibility, provide a short text summary and a table or downloadable dataset alongside the graphic. Describe the takeaway, notable comparisons, and any important caveat in text that works with screen readers. Interactive charts should support keyboard navigation and expose labels and values to assistive technology. Follow applicable accessibility standards and test with users or assistive tools where possible.
There is a trade-off: a simplified chart may be easier to scan but omit detail that some readers need. Keep the main view focused, then offer a clear route to the full data and methods. Accessibility is part of the communication, not a finishing touch.
Present data transparently
A transparent public data visualization identifies its source, definitions, time period, and key methods. Readers need these details to assess whether a chart answers the question and whether its comparisons are fair.
Place source information near the chart, not only in a distant report. Name the agency or dataset, link to the original data when available, and include the date it was accessed or last updated. For open government data, explain whether records have been cleaned, combined, filtered, or suppressed to protect privacy.
Define terms that may be interpreted differently. “Affordable housing units,” for example, could refer to units funded, approved, under construction, or occupied. Those are distinct stages. State which one is counted and whether the figure is a total, rate, percentage, or estimate.
Describe the period and geography clearly. If a chart compares fiscal years with calendar years, or city boundaries changed, readers need to know. For maps, name the geographic unit and explain how values were assigned to it. A brief methods note can state exclusions, calculations, and any changes to collection practices.
These disclosures do not guarantee transparency on their own. A link to a large data file is of limited help if the dataset lacks a data dictionary or cannot be opened with common tools. Good practice connects the chart to usable records and enough documentation for the public to reproduce or question the calculation.
Communicate uncertainty and limitations
Show uncertainty by explaining what is unknown and how it affects interpretation. Estimates, incomplete records, and changing definitions should be visible rather than hidden behind precise-looking numbers.
If the data comes from a sample or model, identify it as an estimate and explain the relevant uncertainty. A range, confidence interval, or error bar may help when readers can interpret it; include a plain-language note about what it represents. Do not add technical uncertainty marks that obscure the chart without improving understanding.
For administrative records, uncertainty may come from missing reports, delayed updates, duplicate entries, or inconsistent definitions between agencies. State the known limitation and its likely direction when that is clear. For example, if some departments submit late, the latest month may appear lower than it will after reporting is complete.
Distinguish “zero” from “no data.” Use an explicit label for missing or suppressed values, and explain privacy protections where small counts are withheld. If a series starts only after a program changed, mark the break rather than drawing a continuous line that suggests direct comparability.
Keep caveats specific and proportionate. A long list of generic warnings can bury the useful information, while no caveat can create false certainty. State what readers can reasonably conclude, what remains uncertain, and what additional evidence would help resolve the question.
Put visualizations in public context
Place a visualization in public context by explaining what the evidence says, what it does not say, and how it relates to policy choices. Separate measured findings from interpretation and proposed action.
A chart showing longer permit processing times in one period can establish a change in recorded processing time. By itself, it cannot establish the cause, prove that a policy produced the change, or show how every applicant experienced the process. Those conclusions may require comparisons, program records, interviews, or other evidence.
Use a short caption to connect the finding to a relevant policy question. For instance: “Average processing time rose after the application system changed; this chart does not isolate the system’s effect from staffing or application volume.” That kind of context helps residents and decision-makers ask better follow-up questions without treating a graphic as proof of a causal claim.
Public agencies should also make it easy to challenge or update the presentation. Include a contact or feedback route, a publication or update date, and a record of major revisions. This matters because policy data changes, and a previously accurate chart can become stale.
Well-designed data visualization supports scrutiny; it cannot replace open records, sound analysis, or public discussion. Its value lies in making evidence easier to inspect while keeping the choices and limitations behind that evidence in view.
Frequently asked questions
Which chart type works best for policy data?
The best chart depends on the question. Use bars for category comparisons, lines for trends over time, distribution charts to show spread, and maps when geography matters. A table is often better when readers need exact values.
How can public agencies make visualizations accessible?
Use plain-language titles and labels, sufficient contrast, and more than color to distinguish information. Provide a text summary and a data table, and make interactive features usable with a keyboard and assistive technology.
What information should accompany a public data visualization?
Include the data source, definitions, units, time period, geographic coverage, and key methods. Disclose relevant exclusions, updates, and privacy-related suppression, and provide a link to usable underlying data when available.
How should a visualization show uncertainty?
Label estimates as estimates and use ranges or error bars when they clarify the evidence. Explain missing or delayed data, distinguish missing values from zero, and state what readers can and cannot conclude.